Create and edit report
A report is a visual display of captured data or information generated from different recordings, events or activities. Reports offer a summary of certain aspects or events. This includes recorded communication activities, user actions or system events. Reports allow you to quickly obtain an overview of relevant information, to identify trends or to monitor compliance requirements.
You can define which information the report is to contain and how it is displayed. The created report is displayed as a widget on the dashboard.
The completed fields and the content selected in drop-down lists define how the report will look. The fields and lists are dynamically adjusted and meaningfully narrowed down depending on the preselection.
- Click on the button
 to create a Create Report a report.
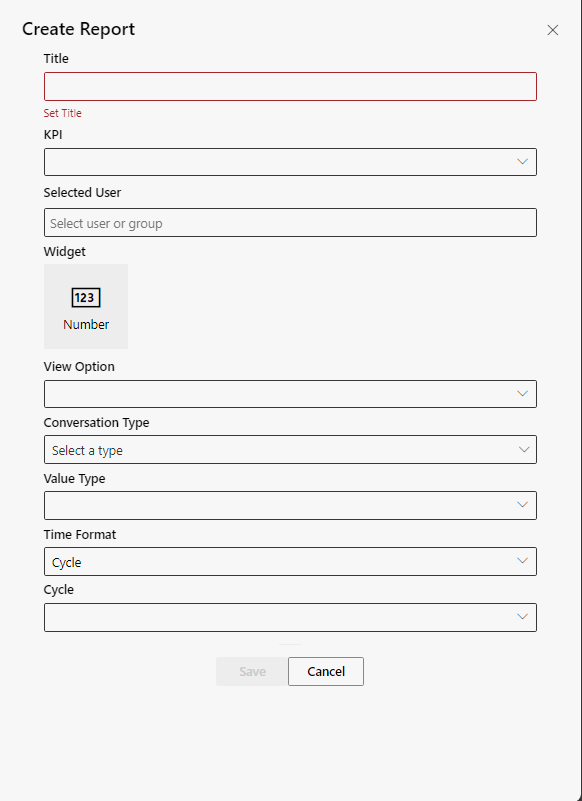
Field / drop-down list | Description | |
Header | Here, you can enter a descriptive title for the report. The title serves to identify the report and briefly describe its content. | |
KPI | KPI (Key Performance Indicator) Here, you can select a key performance indicator to define the focus of the report, see KPI.
| |
Selected User | Here, you can define the users or user groups from which information is supposed to be extracted for the report, see Selected User. This selection makes it possible to focus the report on specific users or groups. | |
Widget | Here, you can select the widget to visualize the data in the report, see Widget and view options
| |
View Option | Here, you can select the view option to adjust the way data is displayed in the report, see Widget and view options
| |
Conversation Type | Here, you can select the conversation type to define which type of recordings are supposed to be assessed, see Conversation Type
| |
Value | Here you can select the desired value to define the output data unit, see Value.
| |
Time Format | Here you can select the desired Time Format and thus the period of time that the report is supposed to cover, see Time Format. Dynamic display when activating: Cycle or User-defined.
|
 =
= =
=  =
=  =
=  =
=  =
=- Click on the button Save to save the settings.
Click on the button Cancel to discard the settings.