Create Report
Visualized reports support the collection of information. You can define which information the report is to contain and how it is displayed. The created report is displayed as a widget on the dashboard. The completed fields and the content selected in drop-down lists define how the report will look. The fields and lists are dynamically adjusted and meaningfully narrowed down depending on the preselection.
Dynamic overlay when activating: KPI. The description of the variable input fields can be found in a second table on this page.
- Click on the button
 to create a Create Report a report.
Legend | Option / function | Description |
1 | Header | Here, you can enter a descriptive title for the report. The title serves to identify the report and briefly describe its content. |
2 | KPI | KPI (Key Performance Indicator) Here, you can select a key performance indicator to define the focus of the report, see KPI.
|
3 | Selected User | Here you can specify the users or user groups from which the information for the report is to be extracted. This selection makes it possible to focus the report on specific users or groups.
The user's access rights determine whether other recordings are available in addition to the user's own recordings. |
4 | Widget | Here you can select the desired display type to visualize the data in your report. For a detailed description, see Widget.
|
5 | View Option | Here you can select the desired view option to customize the display of the data in your report. The view option describes the parameter under consideration. The selection of the view option is displayed dynamically. The view option is preset depending on the KPI and display option.
|
6 | Conversation Type | Here you can select the desired conversation type to define which type of recordings are evaluated. Select one or more conversation types to display or break down the KPI types in more detail. If no conversation type is selected, all conversation types are taken into account.
|
7 | Value | Here you can select the desired value to define the output data unit.
Whether the value Number or Duration/min is displayed for selection depends on the selected KPI type and the selected display type. |
8 | Time Format | Here you can select the desired Select the time format and therefore the period for which the report is to be created. For a detailed description, see Time Format. Dynamic display when activating: Cycle or User-defined.
|
 =
= =
=  =
=  =
=  =
=  =
=Further options / functions based on dyamic overlay
Depending on the KPI selection, additional input fields are displayed dynamically. Here you will find an overview of the other input fields and which KPI they appear with.
Option / function | Description | KPI | |
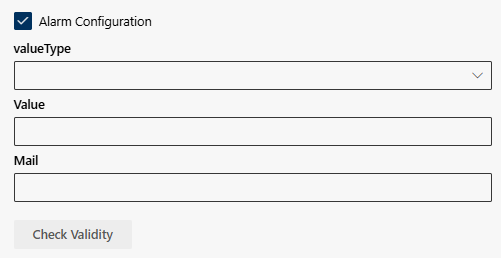
Alarm Configuration | Here you can configure an alarm that notifies you by email for a specific condition. For a detailed description, see Alarm Configuration.
|
| |
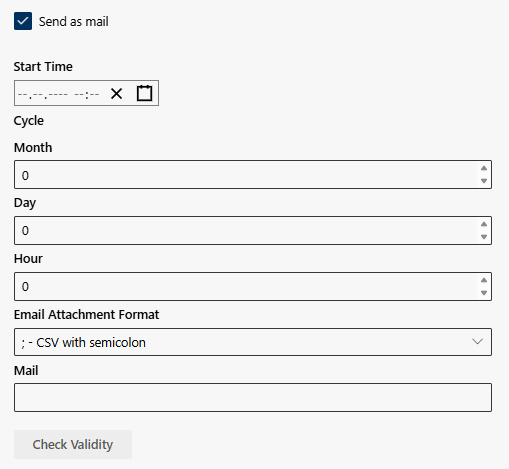
Send as mail | Here you can have an e-mail sent to you at a specific time. For a detailed description, see Send as Email
|
| |
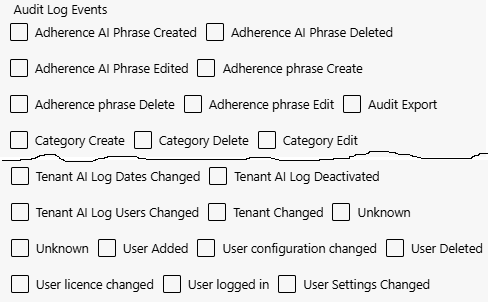
Audit Log Events | You can select one or more audit events here. For a detailed description, see Audit events for creating an audit report
|
| |
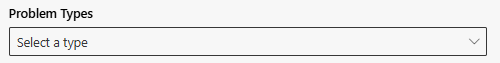
Problem Types | Here you can select one or more problem types.
|
| |
Job ID | You can select one or more job IDs here. The job IDs contain import, export or integration jobs and are configured by the administrator. If you have any questions, please contact your administrator.
|
| |
Keyword | You can add one or more keywords here. Separate several keywords with a comma.
|
| |
Category Selection | Here you can select one or more categories.
|
| |
Show all versions of the category | Here you can decide whether all versions of the categories should be displayed in the Category drop-down field.
|
| |
Policy Selection | You can select one or more policies here.
|
| |
Show all policy versions | Here you can decide whether all versions of the policies should be displayed in the Policy selection drop-down field.
|
|


- Click on the button Save to save the settings.
Click on the button Cancel to discard the settings.